

|
如果免费资源下载的文件为TXT文档 请联系站长更新!站长微信:Lv596999 Telegram:@eapoj “Mql5官网”板块的EA基本都有,大部分是无限制NODLL版,NODLL版本MT1420升级,大多数不可用!这些EA来源为国外花钱买过来的 如有需要,请联系站长! “EA测评”板块资源全部现有,看见不错的,可以联系站长,看EA在确定是否收费。 “无限制EA”板块,大部分免费,下载文件全部存在,都可以免费下载。 站长硬盘EA太多,因大部分时间做交易,做风控,没太多时间更新下载地址,请谅解! 需要更新下载文件,请联系站长微信!国外朋友请联系Telegram。  |
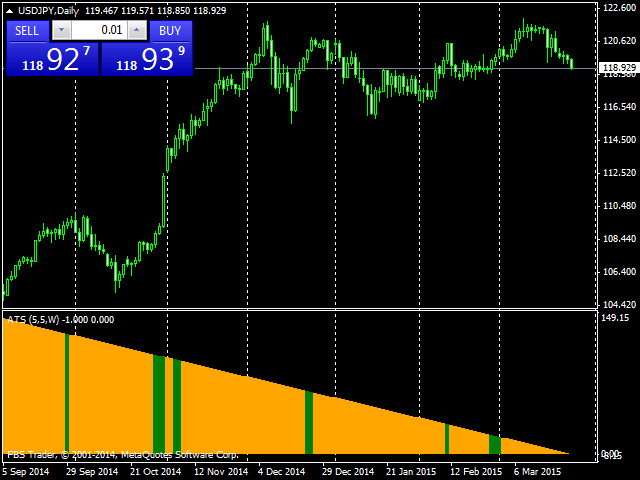
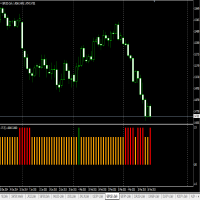
This is an indicator for finding the strongest trend each day, suitable for intraday trading or a swing trading.
See the live performance at : https://www.mql5.com/en/signals/93383
How to Use:
- RED BAR means Bearish Trend for the next candle
- GREEN BAR means Bullish Trend for the next candle
- ORANGE BAR means Sideways Trend for the next candle
Example:
If
we are using D1 timeframe, see the last BAR, if
the bar is RED BAR, open short/sell for today.
If we are
using H1 timeframe, see the last BAR, if the bar is GREEN BAR, open long/buy until next hour.
You can сombined it with Parabolic SAR Indicator for helping you to place the TP & SL.
![图片[1]-Mql5官网 Alpha Trend Spotter 外汇EA-EA侦探社 - 全球领先的MQL5官网外汇EA机器人MT4自动化交易EA资源免费分享网站](https://www.mql5.vip/wp-content/uploads/2024/05/20240521021703-664c041f499d1.png)
![图片[2]-Mql5官网 Alpha Trend Spotter 外汇EA-EA侦探社 - 全球领先的MQL5官网外汇EA机器人MT4自动化交易EA资源免费分享网站](https://www.mql5.vip/wp-content/uploads/2024/05/20240521021704-664c0420118dd.png)